Sales forecast
easy, reliable and collaborative
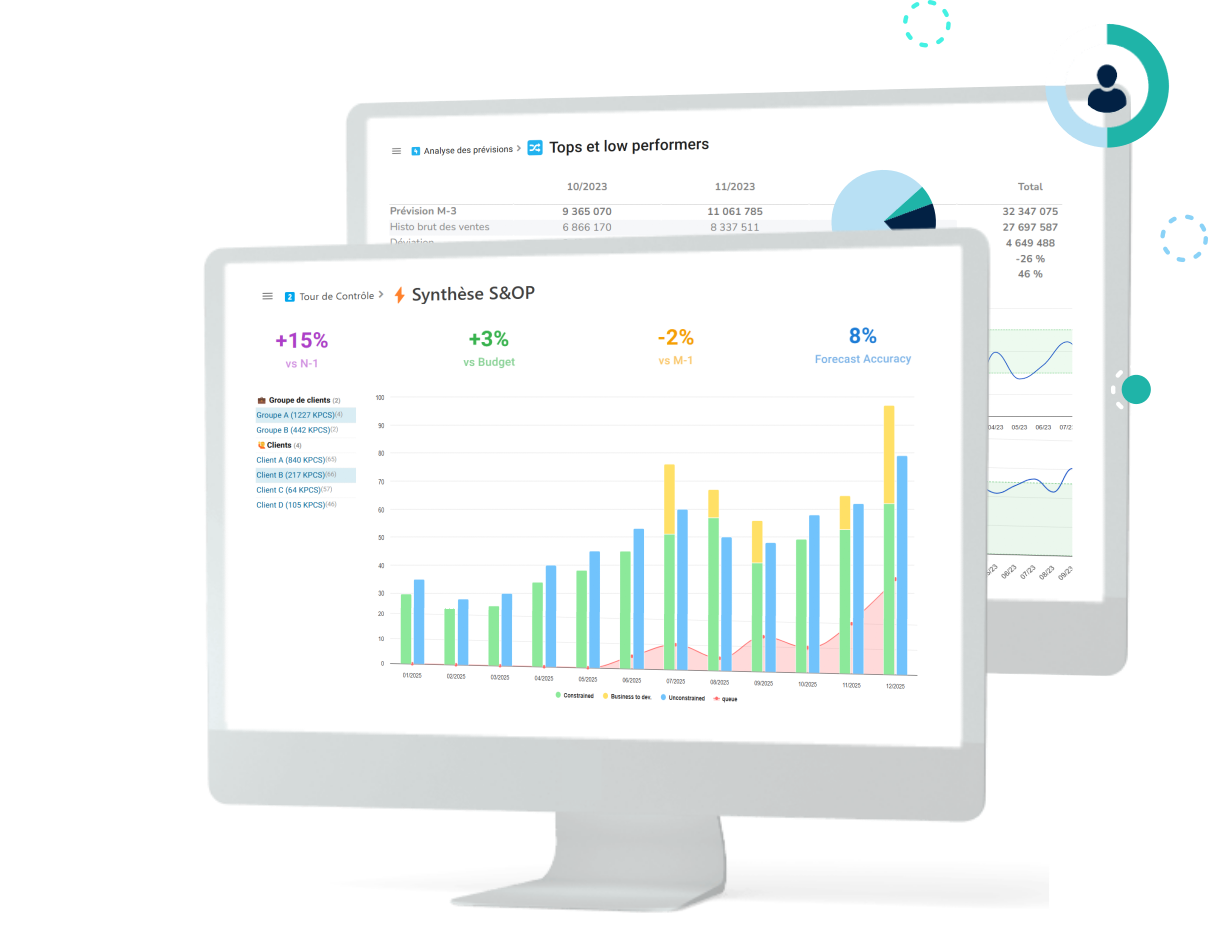
Collaborate in real time with your teams on a single platform, without Excel reprocessing, to produce reliable, shared forecasts ready to feed your production and procurement plans.

Why your sales forecast is strategic

Sales forecasting is at the heart of supply chain performance
Forecasting is no longer a simple statistical exercise; it is a pillar of tactical and strategic management , enabling :
- Reduce overstocking and storage costs
- Minimize shortages and improve service levels
Aligning production, supply and distribution
By synchronizing all the links in the chain, thanks to reliable sales forecasts, the company can produce just what it needs, at the right time, avoiding shortages for customers and costly overstocking for the treasury.
You spend more time preparing data than analyzing it
Time-consuming
"I have to consolidate a multitude of Excel files, with links between files that have become obsolete and time-consuming manual interfaces".
Inability to script
Key questions such as " What happens if demand increases by 15%?" or " How can we anticipate the impact of a supplier disruption?" are difficult to answer.
Difficult collaboration
"It takes a very long time to share each hypothesis. It takes us 3 months to build our forecast.
Obsolete data
The multitude of Excel files prevents real-time data updates and product portfolio monitoring.
How Ganacos transforms sales forecasting

An agile solution for reliable forecasting
Thanks to a single source of data, shared between supply, finance, sales and management teams, you can collaborate in real time, simulate scenarios and adjust your plans in just a few clicks.
Collaborative: Multi-actor input with management of assumptions, comments and versions.
Bottom-up, top-down, hybrid... you define the granularity, hierarchies and logics.
Visualize the impact of a change in demand, a supplier hazard or a new launch.
Easy connection to your existing tools: ERP, CRM, BI.
Make your sales forecasts in a collaborative way
Work simultaneously on the sales forecast and the SOP/S&OP
Reconcile data from multiple enterprise systems
Entering new values from multiple sites following an activity hazard
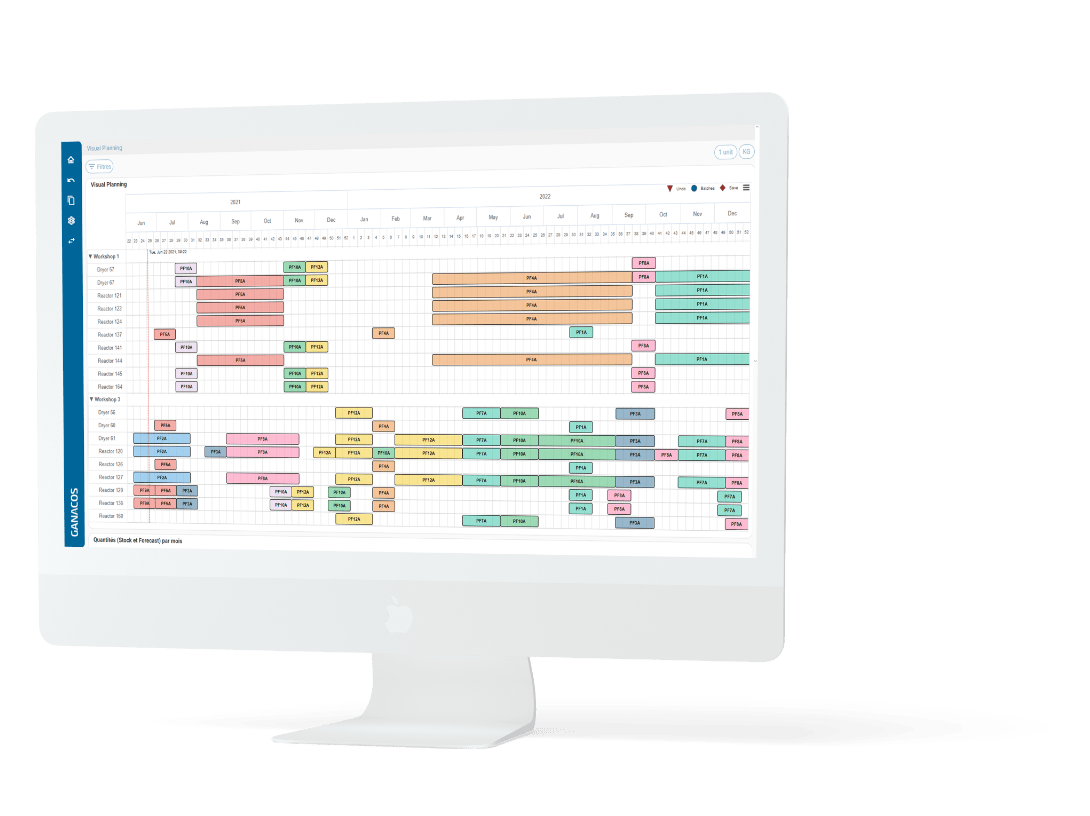
Create and manage your master production plan (MPS)
Re-planning the Master Production Plan in response to new, higher priority orders
Prioritise delivery requests according to known delivery constraints
Calculate the impact on product stocks and coverage

Realise your procurement plan in line with your purchasing strategy
Once set up, the Ganacos solution allows you to optimise stocks and cash flow by continuously comparing activity forecasts and purchase volumes by period. A summary of purchases by month/quarter/year enables the preparation of exchanges with suppliers.
Calculate your purchase volumes from forecast sales
Anticipate purchases based on activity variations and stock levels
Prepare the negotiation phases with suppliers

Optimise your logistics
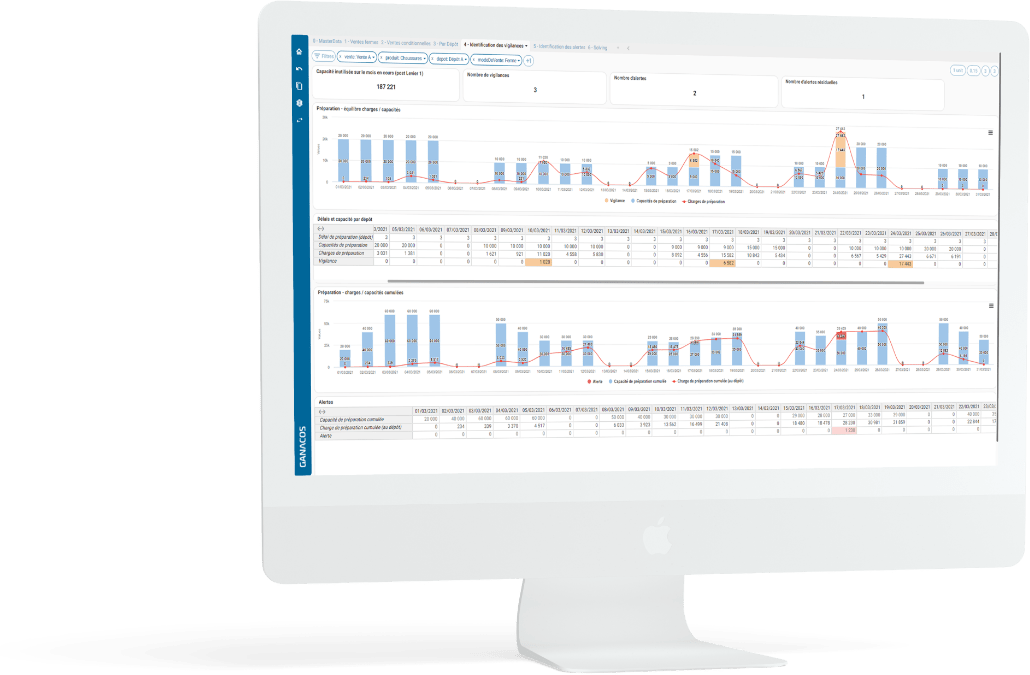
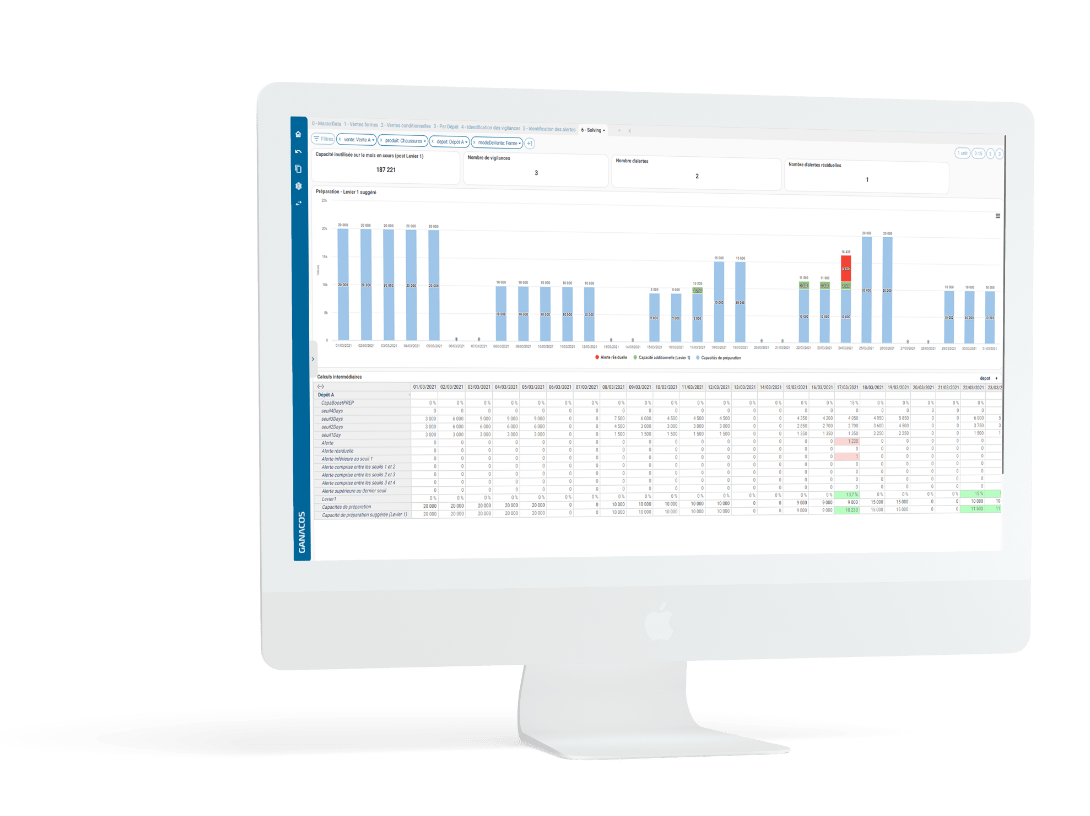
Generate alerts on all stocks that have reached their low levels
Share key indicators with the whole team with associated alert levels
title
text
title 2
text